“Decrying polarization is everyone’s favorite game in Washington, but in the case of the Supreme Court, it’s statistically measurable.” So began an article in The Wire at the end of the United States Supreme Court’s 2011-12 term. Referring to figures supplied by a pair of scholars at the University of Southern California and Washington University in Saint Louis, the author concluded that “there’s a strong case” that “the court is more divided than it has been in history.” Other publications that summer furnished similar assessments, including an article in The Atlantic titled “The Incredible Polarization and Politicization of the Supreme Court.” Two years later its author saw no reason to change his opinion in an essay that the New Republic ran under the title “John Robert’s Supreme Court is as Polarized as Ever.” It seemed so as well to Adam Liptak, whose “Polarized Court” in the New York Times quoted a Boston College political scientist’s conclusion that “Polarization is higher than at any time I’ve ever seen as a citizen or studied as a student of politics.”
Analogous claims have been made regarding Wisconsin’s supreme court, raising the question of how one might determine the degree of polarization on the bench in Madison. A reader suggested that, in addition to measuring Wisconsin’s court against those in other states, it might be instructive to consider the United States Supreme Court as a standard of comparison—which we will do by focusing on two indicators pertinent to the “polarization” discussion: (1) the frequency with which individual justices voted in the majority in non-unanimous decisions, and (2) the percentages of unanimous and contentious decisions during a term.
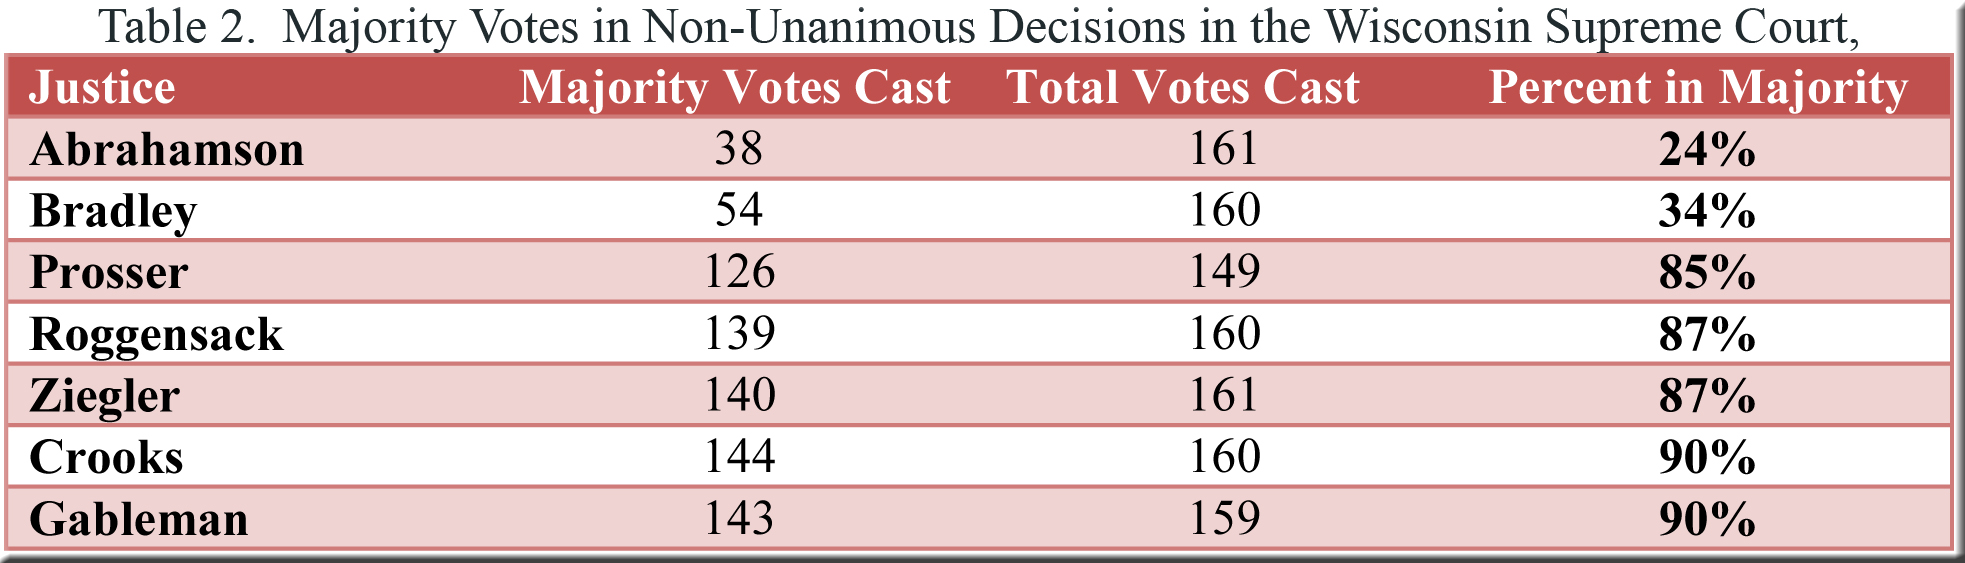
We’ll select the five terms from 2010-11 through 2014-15—a period that blankets the publication dates of the articles quoted in the introduction—and begin with the percentage of votes cast by individual justices in non-unanimous decisions (detailed in Tables 1 and 2).[1] Here the difference between the two courts is vivid, with the justices in Washington DC appearing far less polarized than those in Madison. Eight of the nine members of the United States Supreme Court voted in the majority between 58% and 77% of the time in non-unanimous cases, and even Justice Kennedy, at 84%, could not be considered an outlier. Indeed, the distance between him and Justice Ginsburg at the other end of the range was only 26 percentage points.
How different Wisconsin appears. Not only is there a chasm of 66 percentage points between Justice Abrahamson (24%) and Justices Crooks and Gableman (both 90%), the court as a whole has split into two distinct groups located near the ends of a broad spectrum with no one between them. Equally striking are the low numbers for Justices Abrahamson and Bradley on the one hand, and, on the other, the extremely high and nearly identical figures for the five remaining justices—all at least 85% and all clustered within five percentage points of each other.
(click on tables to enlarge them)

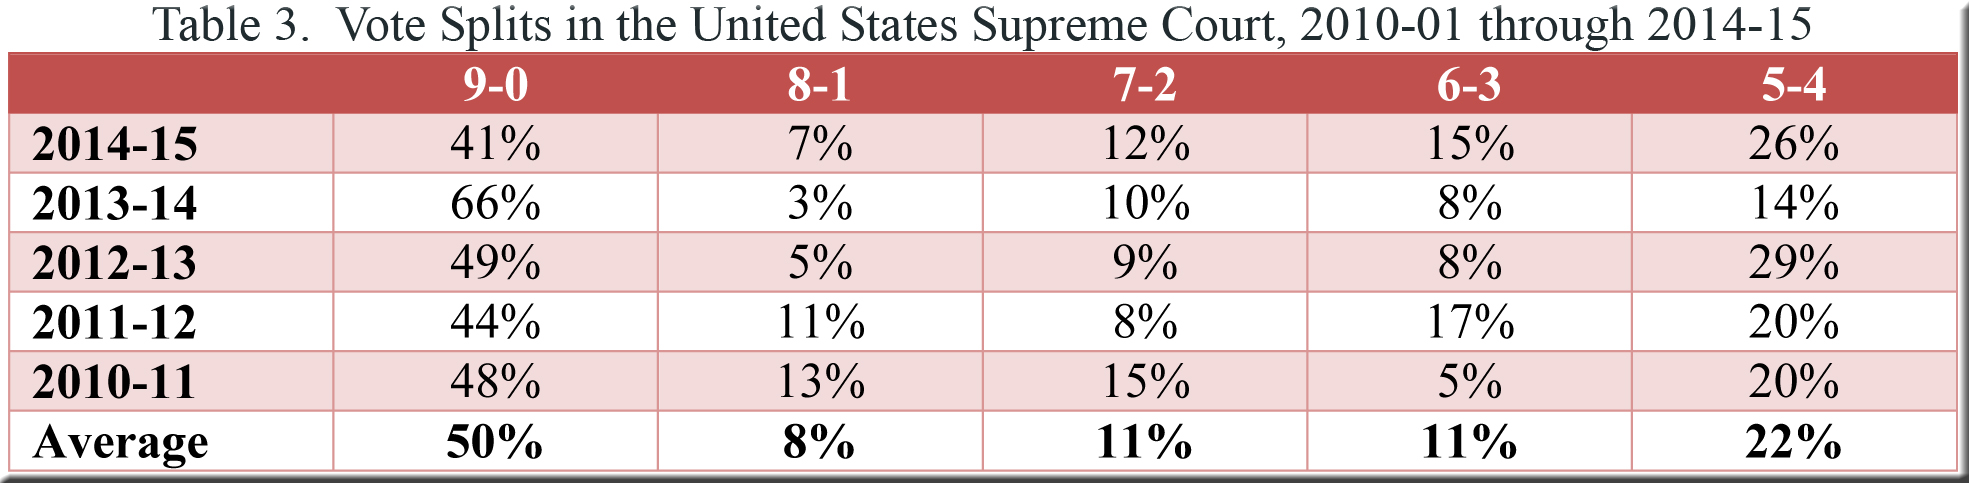
Turning now to our second indicator—the percentages of unanimous and contentious decisions during a term—we encounter more directly the difficulty posed by the fact that the two courts do not have the same number of justices. For instance, one could suppose that, other factors being more or less equal, the greater the number of justices on the bench, the less frequently that all of them would agree on a decision. This might suggest that the United States Supreme Court—said to be unprecedentedly polarized, and with nine justices casting votes—would likely yield a lower percentage of unanimous decisions than would a group of only seven justices in Wisconsin.
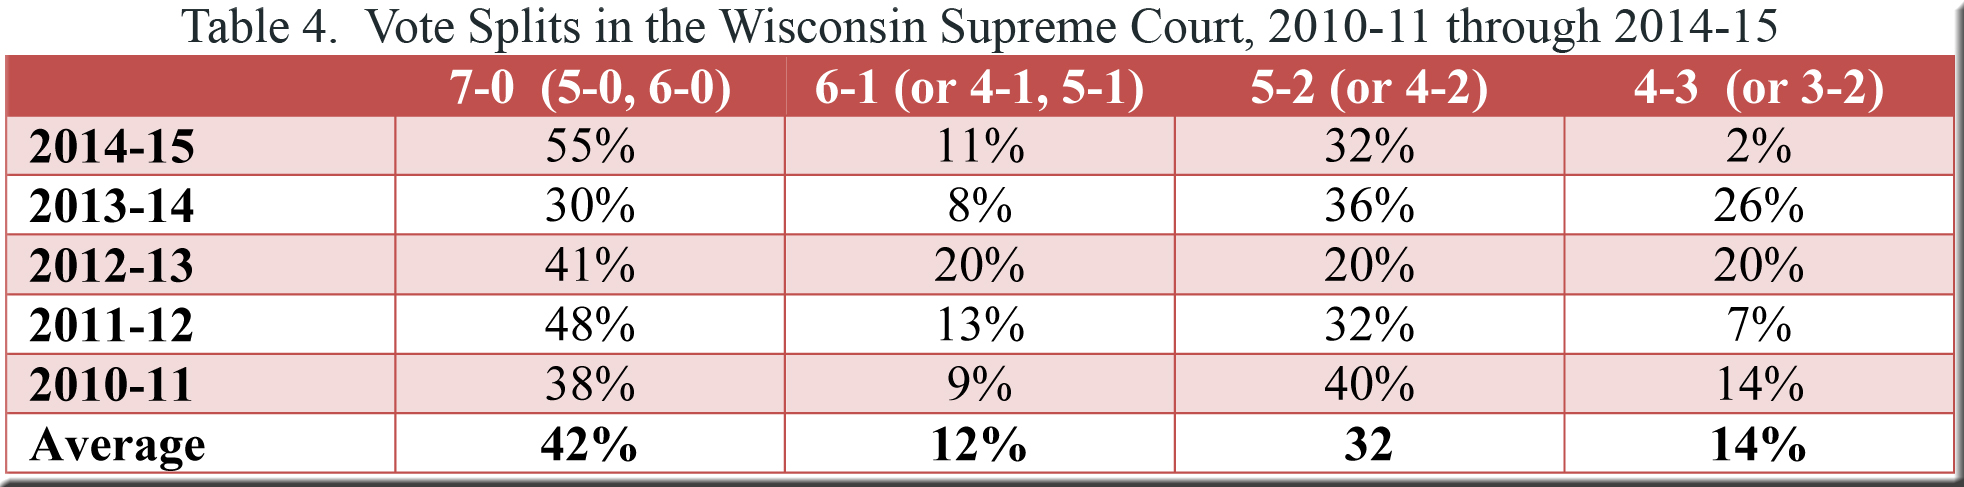
Yet such has not been the case, as shown in Tables 3 and 4.[2] Half of the decisions from the United States Supreme Court were unanimous compared to only 42% in Wisconsin. As for contentious cases—those decided by 5-2 or 4-3 votes in Wisconsin, and by 6-3 or 5-4 votes in Washington DC—the gap was still larger. Fully 46% of the decisions coming from Madison were contentious, exceeding by 13 percentage points the share of such decisions among those filed by the US Supreme Court.
There are certainly other means of detecting divisions among justices. However, if the indicators utilized here are plausible gauges of polarization—and if the United States Supreme Court is indeed more riven than ever—we find ourselves taking another step toward the preliminary conclusion suggested by SCOWstats’s comparison of the Wisconsin and Minnesota Supreme Courts. That is, the Wisconsin Supreme Court may be unusually polarized not only with respect to its own recent history but also in contrast to whatever the norm might be for the nation. Of course, such a hypothesis would have to be tested against the records of additional state supreme courts and against the results of the 2015-16 term nearing its end in Wisconsin. In the meantime, though, these figures from the United States Supreme Court do nothing to discourage speculation that the growing conservative majority and the isolated liberal minority on the bench in Madison have not only split the supreme court into blocs but have done so to an extreme.
[1] Statistics about the United States Supreme Court are available on the first-rate SCOTUSblog site. SCOTUSblog’s table on majority votes cast in non-unanimous decisions did not include a column for the number of majority votes cast by each justice during the 2010-11 term, so I calculated these figures using the information in the table’s other columns and rounding the results up or down as appropriate. The Wisconsin figures in Tables 2 and 4 were compiled from data that can be accessed through the “Statistics for Individual Years” tab on the SCOWstats menu bar.
[2] Due to rounding, the percentages do not add up to 100 in some rows of these two tables. The top line of Table 4 indicates that the “7-0” column also includes 5-0 and 6-0 decisions. Likewise, the “6-1” column includes some 4-1 and 5-1 decisions; the “5-2” column includes some 4-2 decisions, and the “4-3” column includes a few 3-2 decisions. See the SCOTUSblog site for more information on the preparation of tables for the US Supreme Court.
Speak Your Mind