Specialized computer programs can inspect large document collections for information that researchers would have difficulty detecting unaided. One such tool is Linguistic Inquiry Word Count software (LIWC), devised to study “the various emotional, cognitive, and structural components present in individual’s verbal and written speech samples.”[1] A number of journal articles have employed LIWC to scrutinize United States Supreme Court opinions,[2] and I thought that it might be worthwhile to see what this text-mining equipment could unearth when applied to opinions from the Wisconsin Supreme Court.
As a starting point, we’ll focus on majority (and lead) opinions issued during the three terms from 2015-16 through 2017-18.[3] Given that LIWC’s output fills over 80 columns, many of which do not seem useful here,[4] I have selected a smaller array of categories that have the potential to furnish meaningful results. Much of this yield is subjective, reflecting the limitations of text-mining software,[5] and readers will surely interpret the findings variously. But the results do reveal significant differences among justices on some points, and I hope that it proves interesting to ponder these disparities.
Word Counts
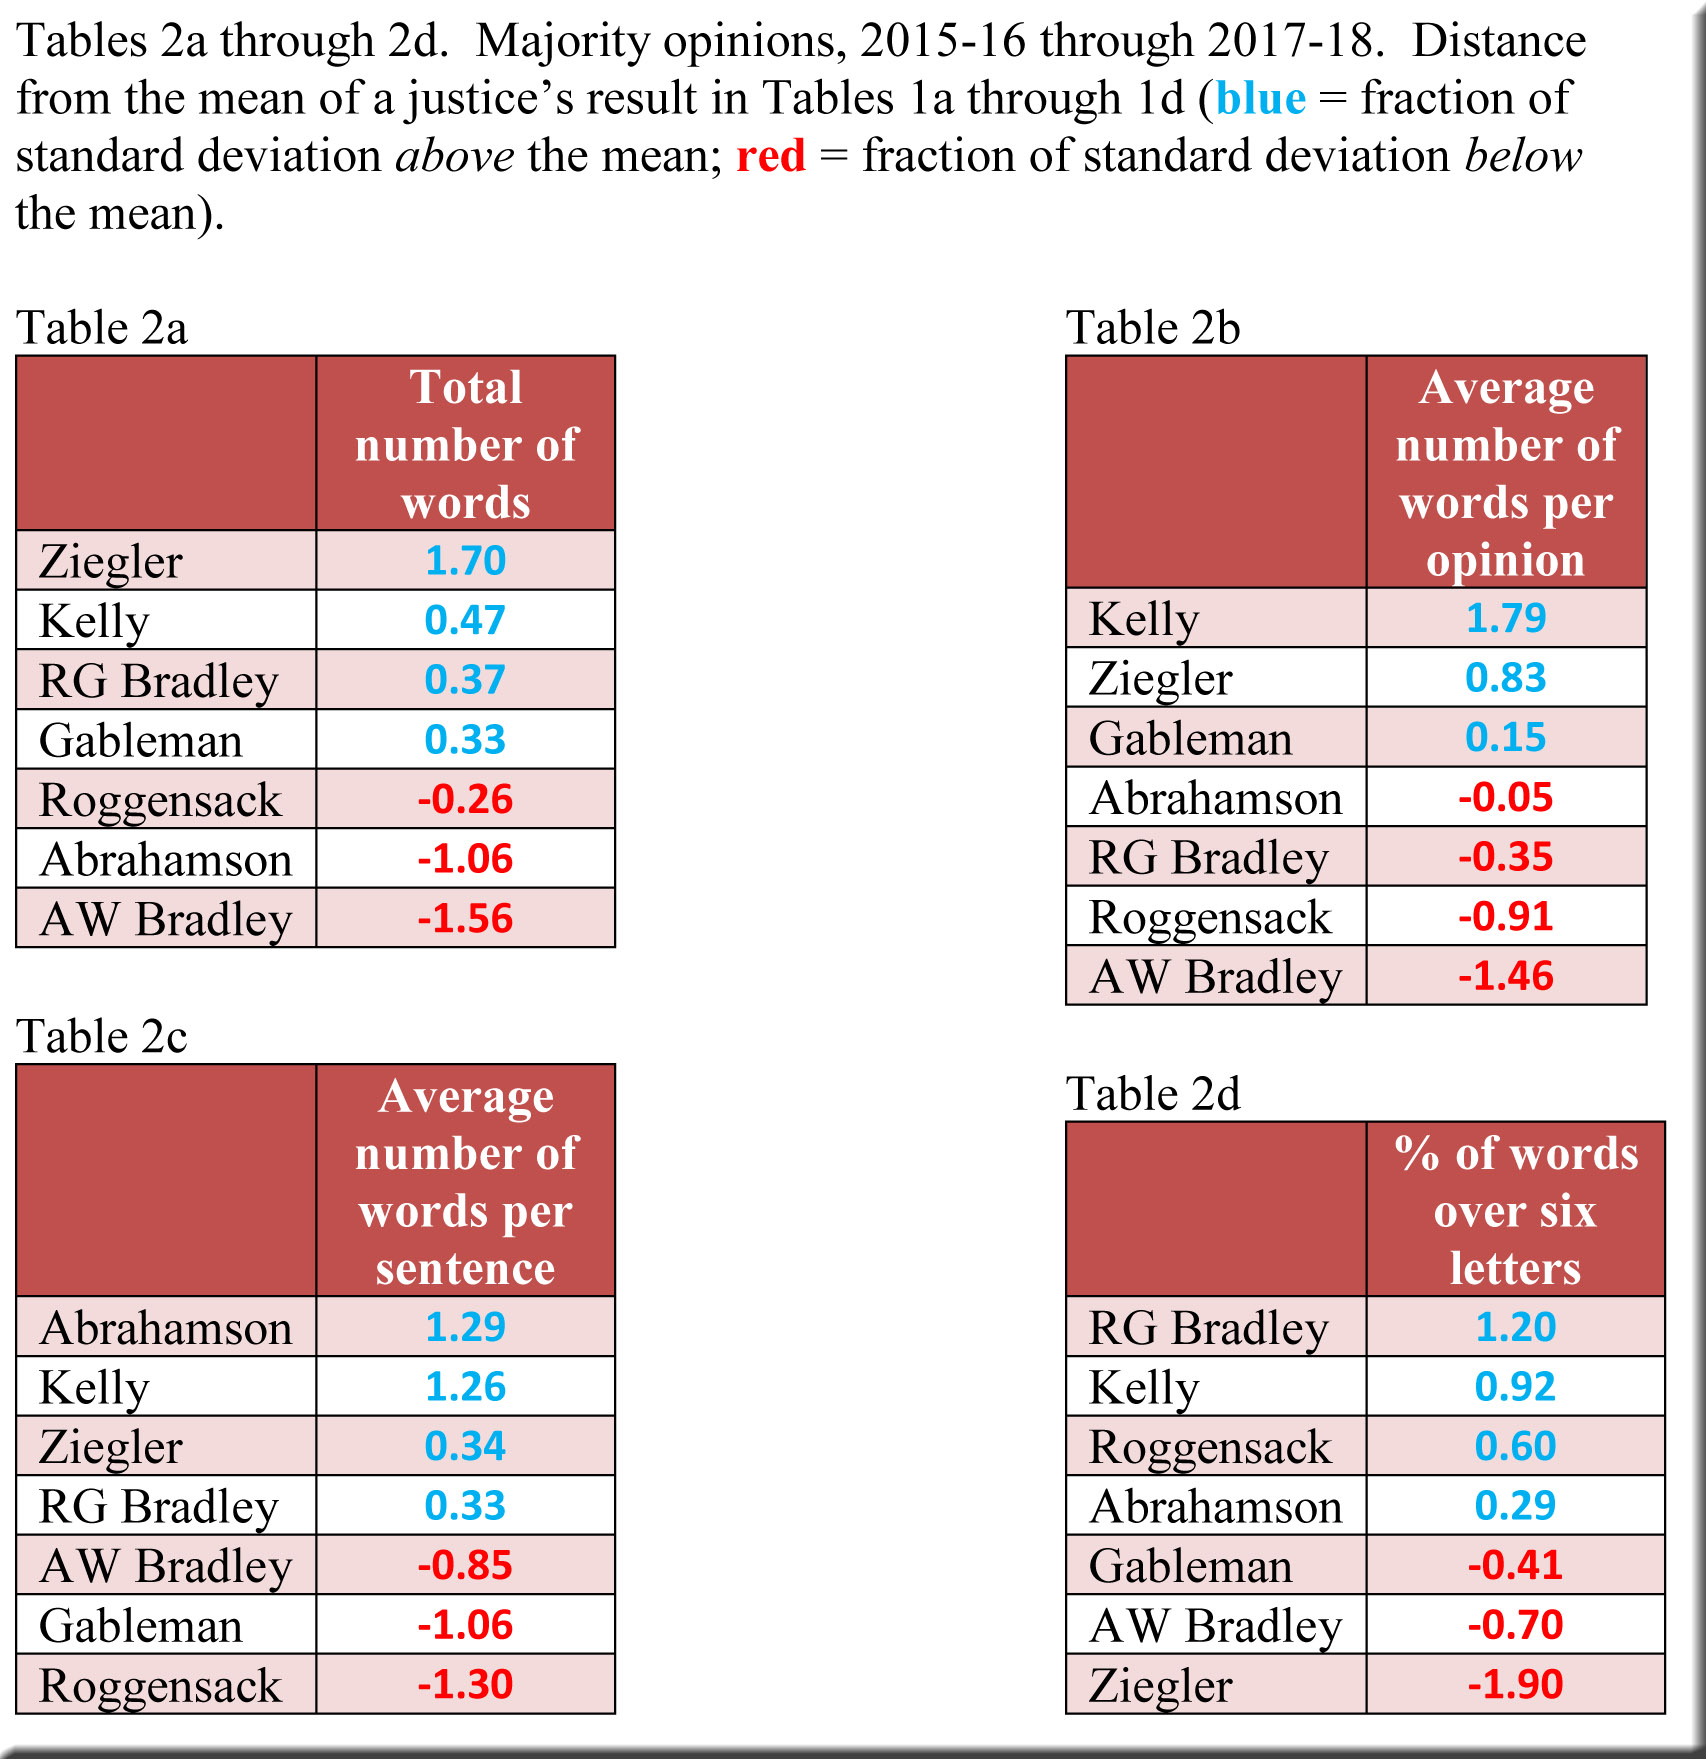
Our first topic is the least speculative in that it involves little more than counting words, though views may differ as to whether figures for a particular justice merit praise, a reproach, or a shrug. The following tables display the total number of words in each justice’s set of majority opinions and the average number of words per opinion, as well as the average length of a sentence and the percentage of words longer than six letters. Justice Kelly emerges with by far the longest opinions—well over a thousand words beyond the average opinion of the next closest Justice (Ziegler). In fact, Justice Ziegler is the only justice whose collection of majority opinions contains more words than Justice Kelly’s total, even though Justice Kelly did not join the court until 2016-17 and thus had only two years to accumulate data for the tables.

Although these tables do rank the justices in each category, they are less effective at highlighting the varying magnitudes between the justices’ “scores.” In an effort to make these differences clearer, I have included a set of tables that show the extent to which each justice’s “score” departs from the average (or mean) for all of the justices. The information is expressed in terms of standard deviations, and the figures may be interpreted as follows in order to sense roughly how far an individual justice’s “score” resides above or below the average for the group.[6] A number close to zero indicates that a justice is near the group’s average, while a higher number (generally between 1 and 2) places a justice’s “score” well above the average. In similar fashion, negative numbers ranging from -1 to -2 represent a “score” considerably below the average.[7]
In Table 2b, for instance, the figures near zero for Justice Abrahamson (-0.05) and Justice Gableman (0.15) denote “scores” very close to the court’s average. On the other hand, the figures for Justice Ziegler in Table 2d (-1.90) and for Justice Kelly in Table 2b (1.79) signal “scores” a good deal below (Ziegler) or above (Kelly) the average.
Tenor of Opinions
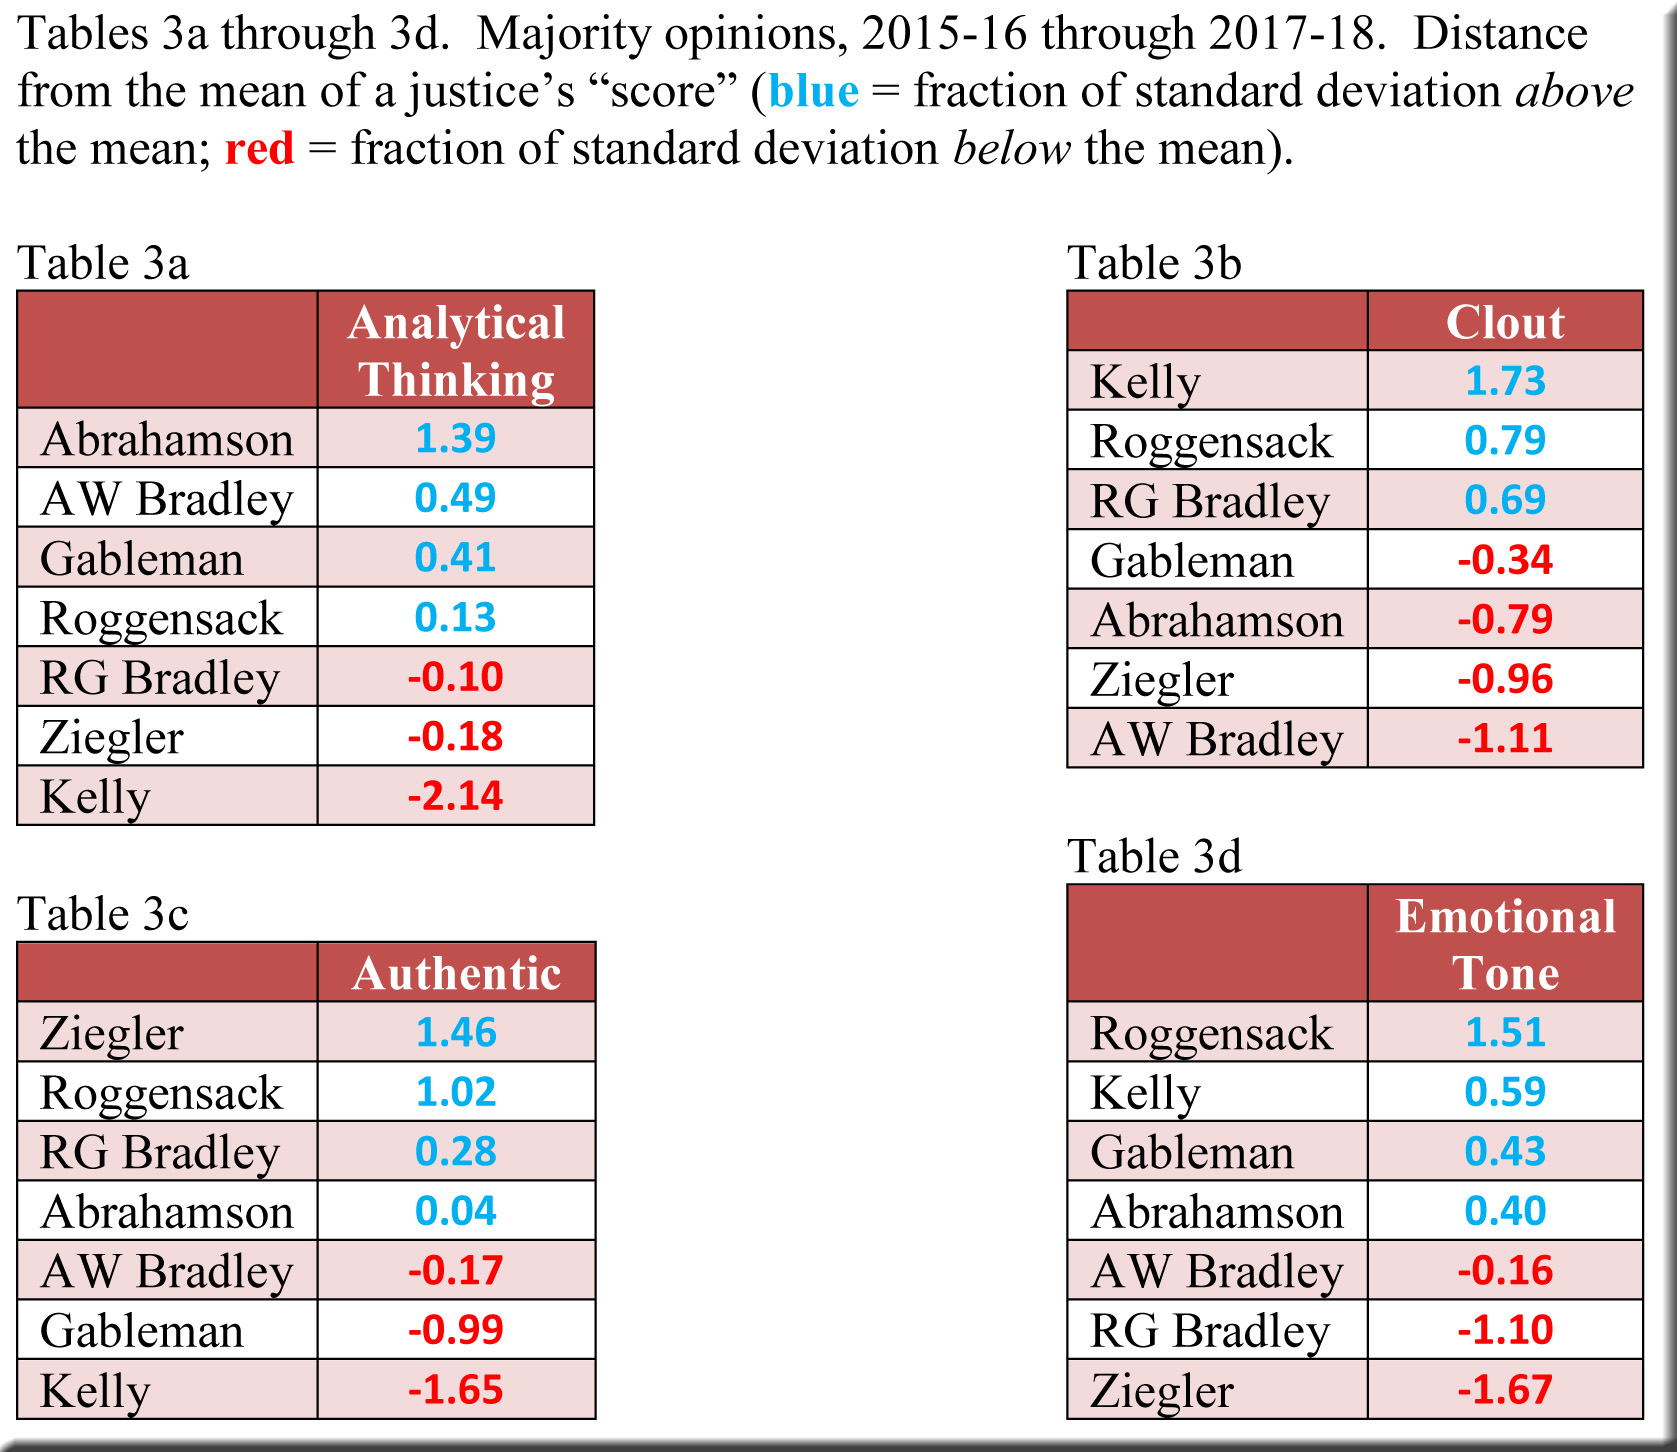
LIWC’s centerpiece consists of four “summary variables”—“Analytical Thinking,” “Clout,” “Authentic,” and “Emotional Tone”—which are derived from proprietary algorithms. The creators of LIWC have described the four variables as follows:
Analytical thinking: “A high number reflects formal, logical, and hierarchical thinking; lower numbers reflect more informal, personal, here-and-now, and narrative thinking.”
Clout: “A high number suggests that the author is speaking from the perspective of high expertise and is confident; low Clout numbers suggest a more tentative, humble, even anxious style.”
Authentic: “Higher numbers are associated with a more honest, personal, and disclosing text; lower numbers suggest a more guarded, distanced form of discourse.”
Emotional tone: “A high number is associated with a more positive, upbeat style; a low number reveals greater anxiety, sadness, or hostility. A number around 50 suggests either a lack of emotionality or different levels of ambivalence.”[8]
Although considerable testing has accompanied the creation of the algorithms that generate these variables, and they have been accepted by numerous scholars in the articles that I have cited, judgements will surely differ as to how desirable (or undesirable) it may be to score near the top (or bottom) of any of these categories.
That said, the results should foster contemplation, as they disclose some pronounced contrasts among the justices. As with the initial set of categories, I have arranged the findings in four tables that show how far each justice’s “score” landed above or below the court’s average.[9] To my eye, the figures for Justice Kelly seem the most intriguing: much farther below the mean than any other justice in the “analytical thinking” category and in the “authentic” category, but towering over every other justice in the “clout” category.
Two justices (AW Bradley and Ziegler) have “scores” below the mean in three of the four categories—though Justice Bradley is very close to the mean in both the “authentic” and “emotional tone” categories, and Justice Ziegler is similarly close in “analytical thinking.” Justice Roggensack is essentially at the mean in the first category, but well above it in the remaining three. No doubt other aspects of these tables merit comment, and I would be grateful for any insight that readers can provide.
Words of Emotion
Our last topic focuses entirely on words associated with various emotions, which LIWC counts and presents as percentages of the total number of words employed by an author. The following tables include two general categories—“positive emotion” and “negative emotion”—along with three columns with more-specific labels: “anxiety,” “anger,” and “sad.”
According to LIWC, Justice RG Bradley’s opinions are the best place to look for words associated with emotions—positive and negative alike. She ranks #1 in both of the two general categories as well as in two of the three specific categories (and #2 in the third). Justice Ziegler also ranks high in the negative-emotion categories, but, unlike Justice Bradley, she “scores” far below the mean for words of positive emotion. LIWC highlights Justice Roggensack as the author whose opinions are least likely to contain words of “negative emotion” in general or those related to “anxiety” and “anger.”[10]

Looking ahead
As I worked through this material, I wondered how these results for the justices’ majority opinions would compare with those that LIWC could generate for their dissents. In the next post, we’ll find out.
[1] J.W. Pennebaker et al., The Development and Psychometric Properties of LIWC2015 (Austin, TX: University of Texas at Austin, 2015), 1.
[2] See for example: Ryan J. Owens and Justin P. Wedeking, “Justices and Legal Clarity: Analyzing the Complexity of U.S. Supreme Court Opinions,” Law & Society Review, vol. 45 (2011), no. 4; Pamela C. Corley and Justin Wedeking, “The (Dis)Advantage of Certainty: The Importance of Certainty in Language,” Law & Society Review, vol. 48 (2014), March; and Amanda C. Bryan and Eve M. Ringsmuth, “Jeremiad or Weapon of Words? The Power of Emotive Language in Supreme Court Dissents,” Journal of Law and Courts, Spring, 2016.
[3] For each justice, I collected all of his/her majority opinions and removed the introductory pages as well as any appendices and separate opinions by colleagues. After running these majority opinions through LIWC, I computed the average “scores” for each justice’s set of opinions in each of the LIWC categories included in the tables. Per curiam decisions are excluded, of course. So, too, are opinions written by Justice Prosser, because the tables cover only his final term. Justice Kelly is included, though his data come only from 2016-17 and 2017-18.
[4] For instance, the number of pronouns or the number of commas.
[5] For more on the capabilities and limitations of LIWC, see (in addition to the articles cited above): Frank B. Cross and James W. Pennebaker, “The Language of the Roberts Court,” Michigan State Law Review (2014); Paul M. Collins, Jr., Pamela C. Corley, and Jesse Hamner, “The Influence of Amicus Curiae Briefs on U.S. Supreme Court Opinion Content,” Law & Society Review, vol. 49 (2015), December; and Bryan Myers et al., “The Heterogeneity of Victim Impact Statements: A Content Analysis of Capital Trial Sentencing Penalty Phase Transcripts,” Psychology, Public Policy and Law, vol. 24 (2018). Corley and Wedeking, in “The (Dis)Advantage of Certainty,” address the issue of quotations included within opinions.
[6] The term “standard deviation” indicates that approximately 68% of the data are included within one standard deviation on either side of the mean, and roughly 95% of all data are included within two standard deviations on either side of the mean.
[7] It is possible to have numbers higher than 2 and lower than -2, which would indicate an even larger gap—greater than two standard deviations—between a “score” and the mean.
[8] James W. Pennebaker et al., Linguistic Inquiry and Word Count: LIWC2015 (Austin, TX: Pennebaker Conglomerates, 2015). The pages are unnumbered; see the second page from the end.
[9] Click here for tables that provide the justices’ raw LIWC “scores” for these four categories.
[10] Click here for a table that provides the justices’ raw LIWC “scores” for these five categories.
Speak Your Mind