Three and a half years ago, we measured certain aspects of the Wisconsin Supreme Court’s performance against corresponding activity at the supreme courts of Minnesota, Iowa, Illinois, and Michigan over the period 2013-14 through 2015-16. Since then, three more terms have gone into the books, providing enough information for another look at the output of these five judicial summits.
Number of decisions.
In some respects, the picture formed by the three most recent terms resembles that displayed in the earlier post. The justices in Minnesota and Iowa continue to file far more decisions per term than do their colleagues in the other three states—and the productivity of the Michigan Supreme Court remains well below that of all the others.[1] Although it may be too severe to characterize the volume of Michigan’s decisions as a mere trickle compared to the numbers generated in Minnesota and Iowa, the gap between these courts is striking. As shown in Table 1, the justices in Minnesota and Iowa resolved fully three times as many cases per term as did their counterparts in Michigan.

The numbers in Table 1 also reveal a significant change. During the period covered by the first post, the Illinois Supreme Court filed substantially more decisions per term (66) than did the justices in Madison (52). Since then, however, Wisconsin has turned the tables on Illinois, as the yield per term in Springfield plunged to 49 decisions, while Wisconsin’s average crept up to 55.
Polarized voting.
The previous post explored signs of polarization among justices—in particular, the percentage of “contentious” decisions contrasted with the share of unanimous outcomes. A large portion of contentious decisions (4-3 and 5-2 votes)[2] suggested more polarization, while a high percentage of unanimous decisions suggested less. By these measures, detailed in Table 2, the Wisconsin Supreme Court appeared much more polarized in the period from 2013-14 through 2015-16 than did the supreme courts of its four neighbors.

The next three years (Table 3) witnessed virtually no change in this regard—neither in the percentages for any of the five courts, nor in the vivid indications of polarization in Madison. Along with a dramatically lower rate of unanimous decisions, Wisconsin’s high percentage of 5-2 (and 4-2) results protrudes in boldest relief, emphasizing the isolation of the court’s two liberals.

Separate opinions.
We turn now to a topic not covered in the previous post—the quantity of concurrences and dissents written by the justices in the five supreme courts. While the raw numbers of these separate opinions are of some interest (and are included in Table 4), they are also misleading because of the disparity in the volume of decisions produced by the courts. To compensate, we’ll calculate the average number of dissents and concurrences per 100 decisions in each state and highlight these averages in Table 4.
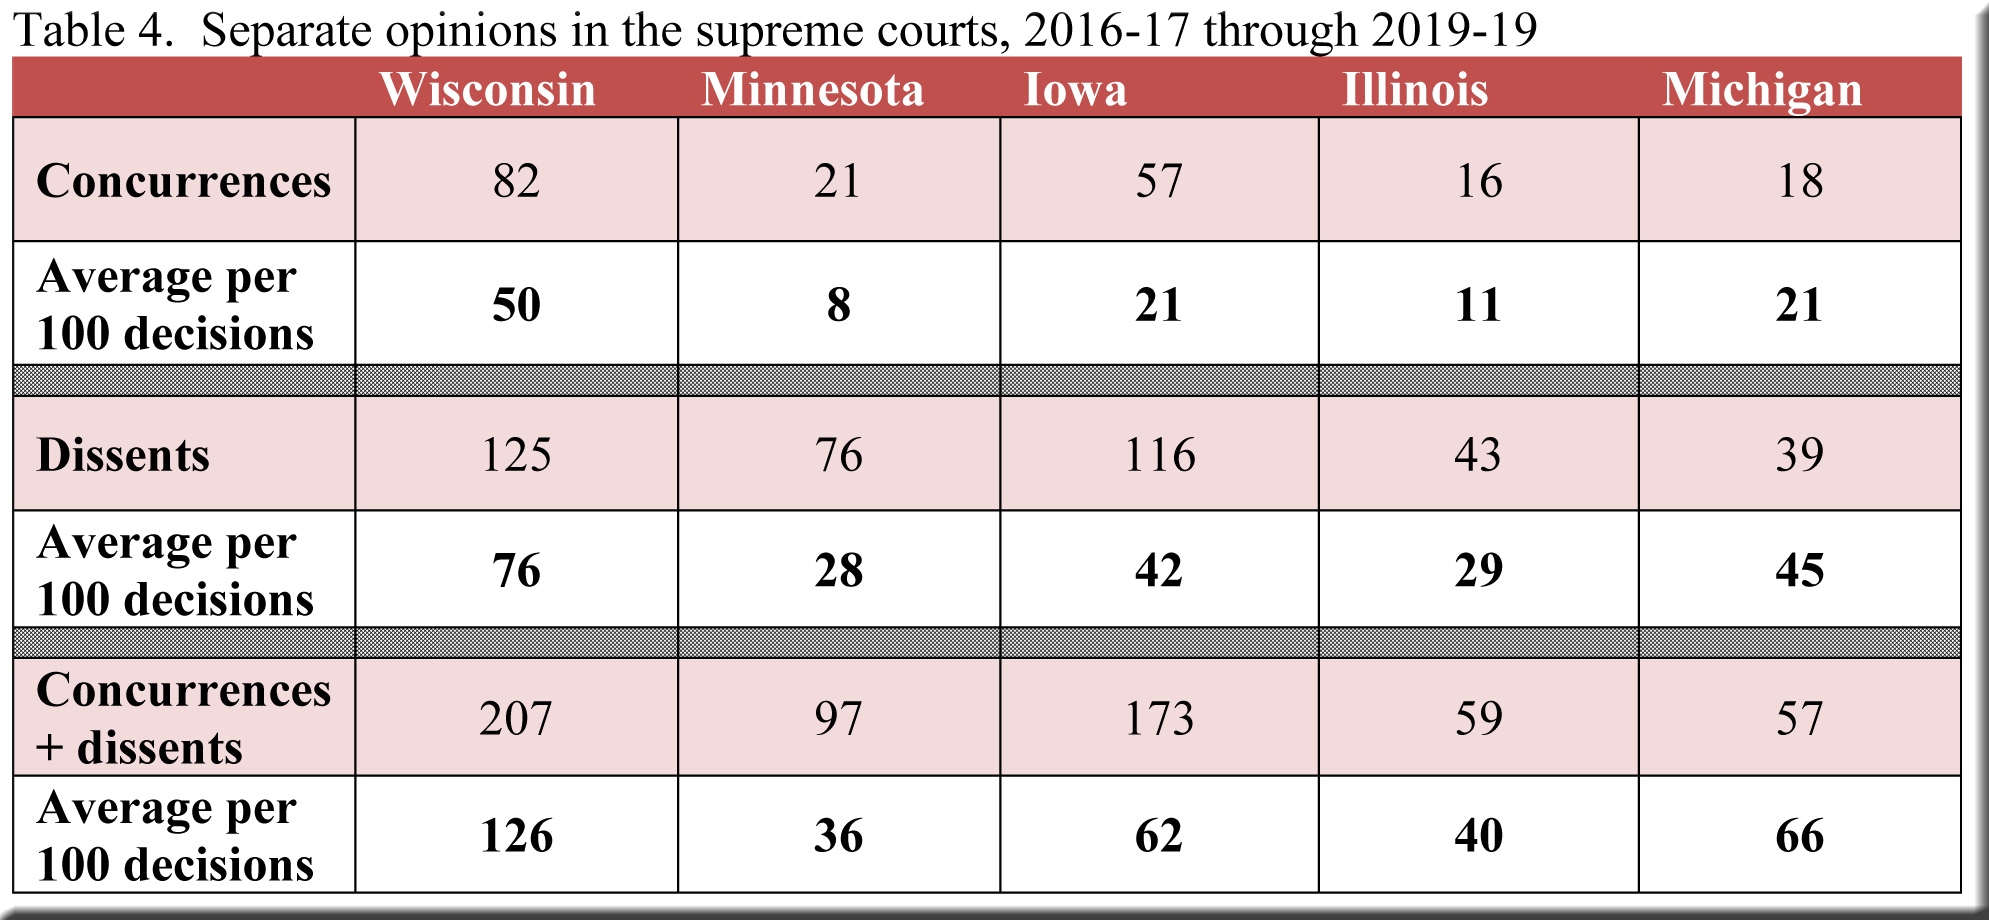
Several things stand out in Table 4, including the relatively small number of separate opinions per 100 decisions in Minnesota and Illinois. But most conspicuous of all is the massive number of separate opinions authored in Wisconsin (126 per 100 decisions), eclipsing the averages for all of the other states. This holds true for both concurrences and dissents—but especially dissents, where Wisconsin’s average is almost two and a half times that of the next closest states (Michigan and Iowa). In view of the results in our “Polarized voting” section—showing a much higher level of contentious decisions in Wisconsin—it should occasion no surprise to find separate opinions sprouting with greater frequency in the Badger State than anywhere else.[3]
[1] I used September 1 as the starting date for a term, and August 31 of the following year as the ending date. The decision totals do not include rulings arising from (1) disciplinary matters involving lawyers and judges, and (2) various petitions, motions, applications and the like (generally disposed of without oral argument and in very short per curiam decisions). Inevitably, it was difficult to decide whether to include a handful of these orders, but they were so few in number as to have no appreciable effect on the tables in this post. Decisions with 3-3 vote splits are excluded.
[2] Also included are a small number of 3-2 and 4-2 decisions.
[3] In similar fashion, Minnesota and Illinois, with the lowest rates of contentious decisions, have the lowest averages of separate opinions per decision. Iowa and Michigan, with higher (and very similar) rates of contentious decisions, have higher (and very similar) averages of separate opinions per decision. But neither one of these pairs of courts even approaches the figures for Wisconsin.
Speak Your Mind