Armed with findings from the supreme court’s just-completed term, we can compare the justices’ activity in several areas with their corresponding performances during previous terms. Last year, all these measures of the court’s work extended recent trends—but not one of them did so in 2019-20.
Fractured decisions
This topic presents a challenge, primarily because of two unusual decisions filed by the court at the end of its term: Service Employees International Union (SEIU), Local 1 v. Robin Vos and Nancy Bartlett v. Tony Evers.
Although “fractured decisions” have been the subject of law review articles from time to time (generally regarding the US Supreme Court),[1] the phrase does not appear to have a precise, technical definition. I settled on counting cases with “lead opinions” or “plurality opinions”—as opposed to “majority opinions”—thinking that sufficient to identify instances where the court could not assemble a majority to agree on a mandate and a rationale. Yet, I was never entirely comfortable with this approach, because it excluded deadlocked per curiam decisions, which are at least as fractured (and of no precedential value) as any other decision in this category. Now, with Service Employees and Nancy Bartlett, I am even less satisfied with my customary methodology.
In Service Employees, the court divided the issues at hand into two portions—each with its own “majority opinion,” one by Justice Hagedorn (joined by Justices Roggensack, Ziegler, RG Bradley, and Kelly) and the other by Justice Kelly (joined by Justices AW Bradley, RG Bradley, and Dallet).[2] This posed a categorization problem, as the court had avoided the label “lead opinion” for its ruling(s). It still seemed like a fractured decision, and, in the end, I decided to classify it as such because of a law review article that characterized a US Supreme Court decision (United States v. Booker) as the product of a fractured court, “despite the presence of two majority opinions,” just as in Service Employees.[3]
The other awkward case, Nancy Bartlett, concerned a series of vetoes issued by Governor Evers. After acknowledging that “[n]o rationale has the support of a majority,” the court explained in a per curiam decision that it had split the governor’s vetoes into three sets, each of which received a ruling approved by a different majority of justices. Accompanying this anonymous explanation were four separate opinions—three of them concurring in part and dissenting in part.
Following the example of Service Employees, the court could have issued three separate “majority opinions,” though perhaps the justices balked at diluting the term “majority opinion” so severely. It would be interesting to know what transpired in their discussions. That said, and with only the information summarized here as a guide, I decided to classify Nancy Bartlett as a fractured decision.
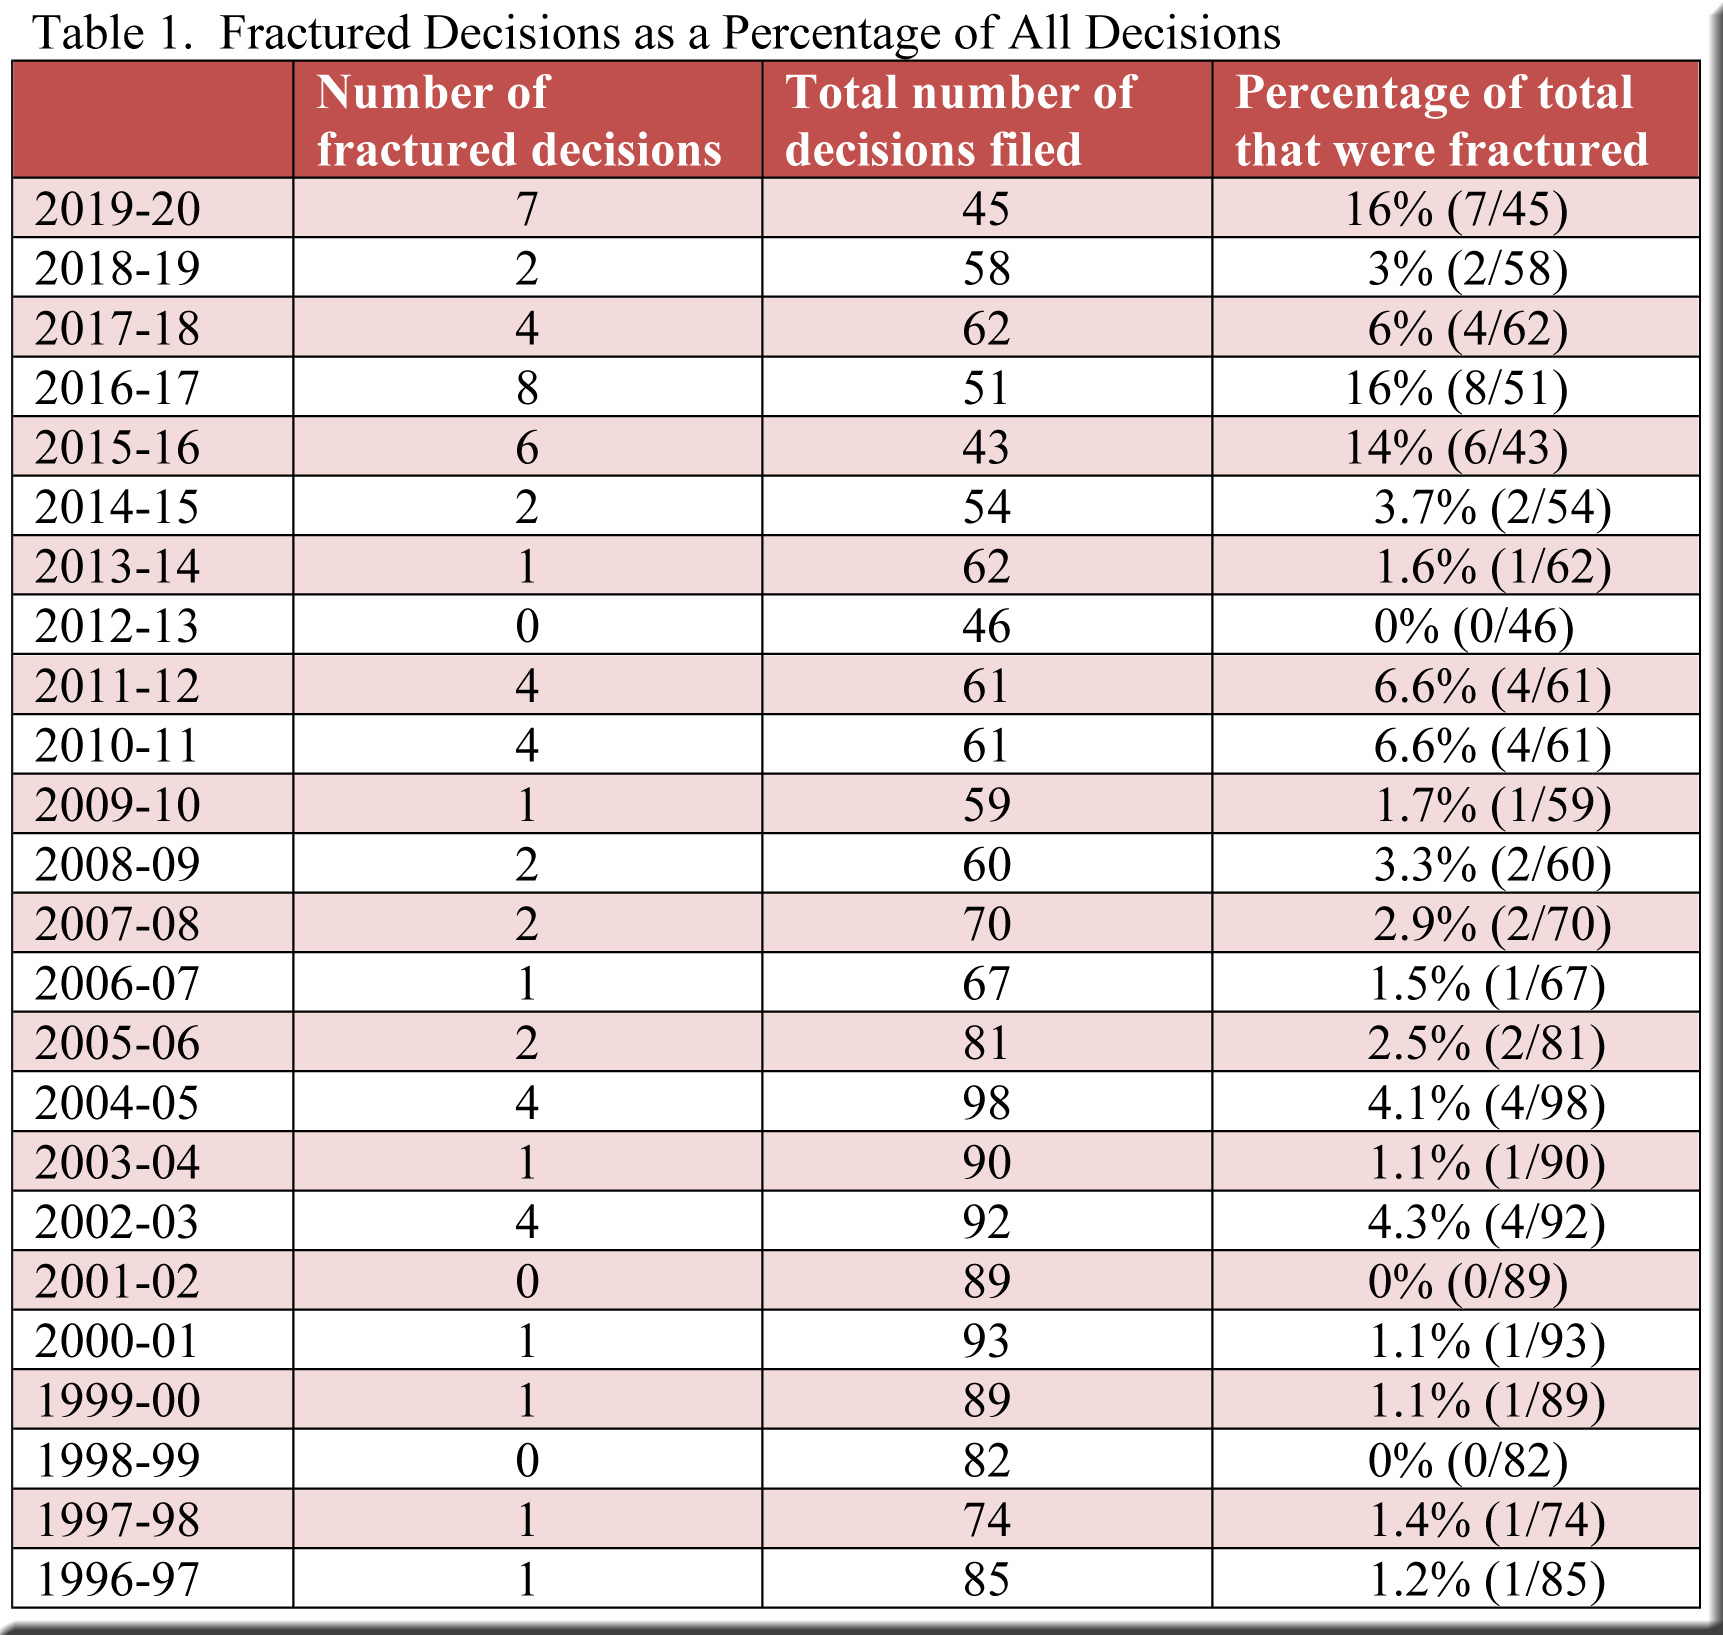
All that thrashing around yielded the results displayed in Table 1, where we find that the rate of fractured decisions soared in 2019-20. Even if the “fractured” label were removed from both Service Employees and Nancy Bartlett, the percentage of fractured decisions (11%) would still be very high—and at 16% it has returned to the highest level of the 24 terms covered by the table.
Frequency of separate opinions
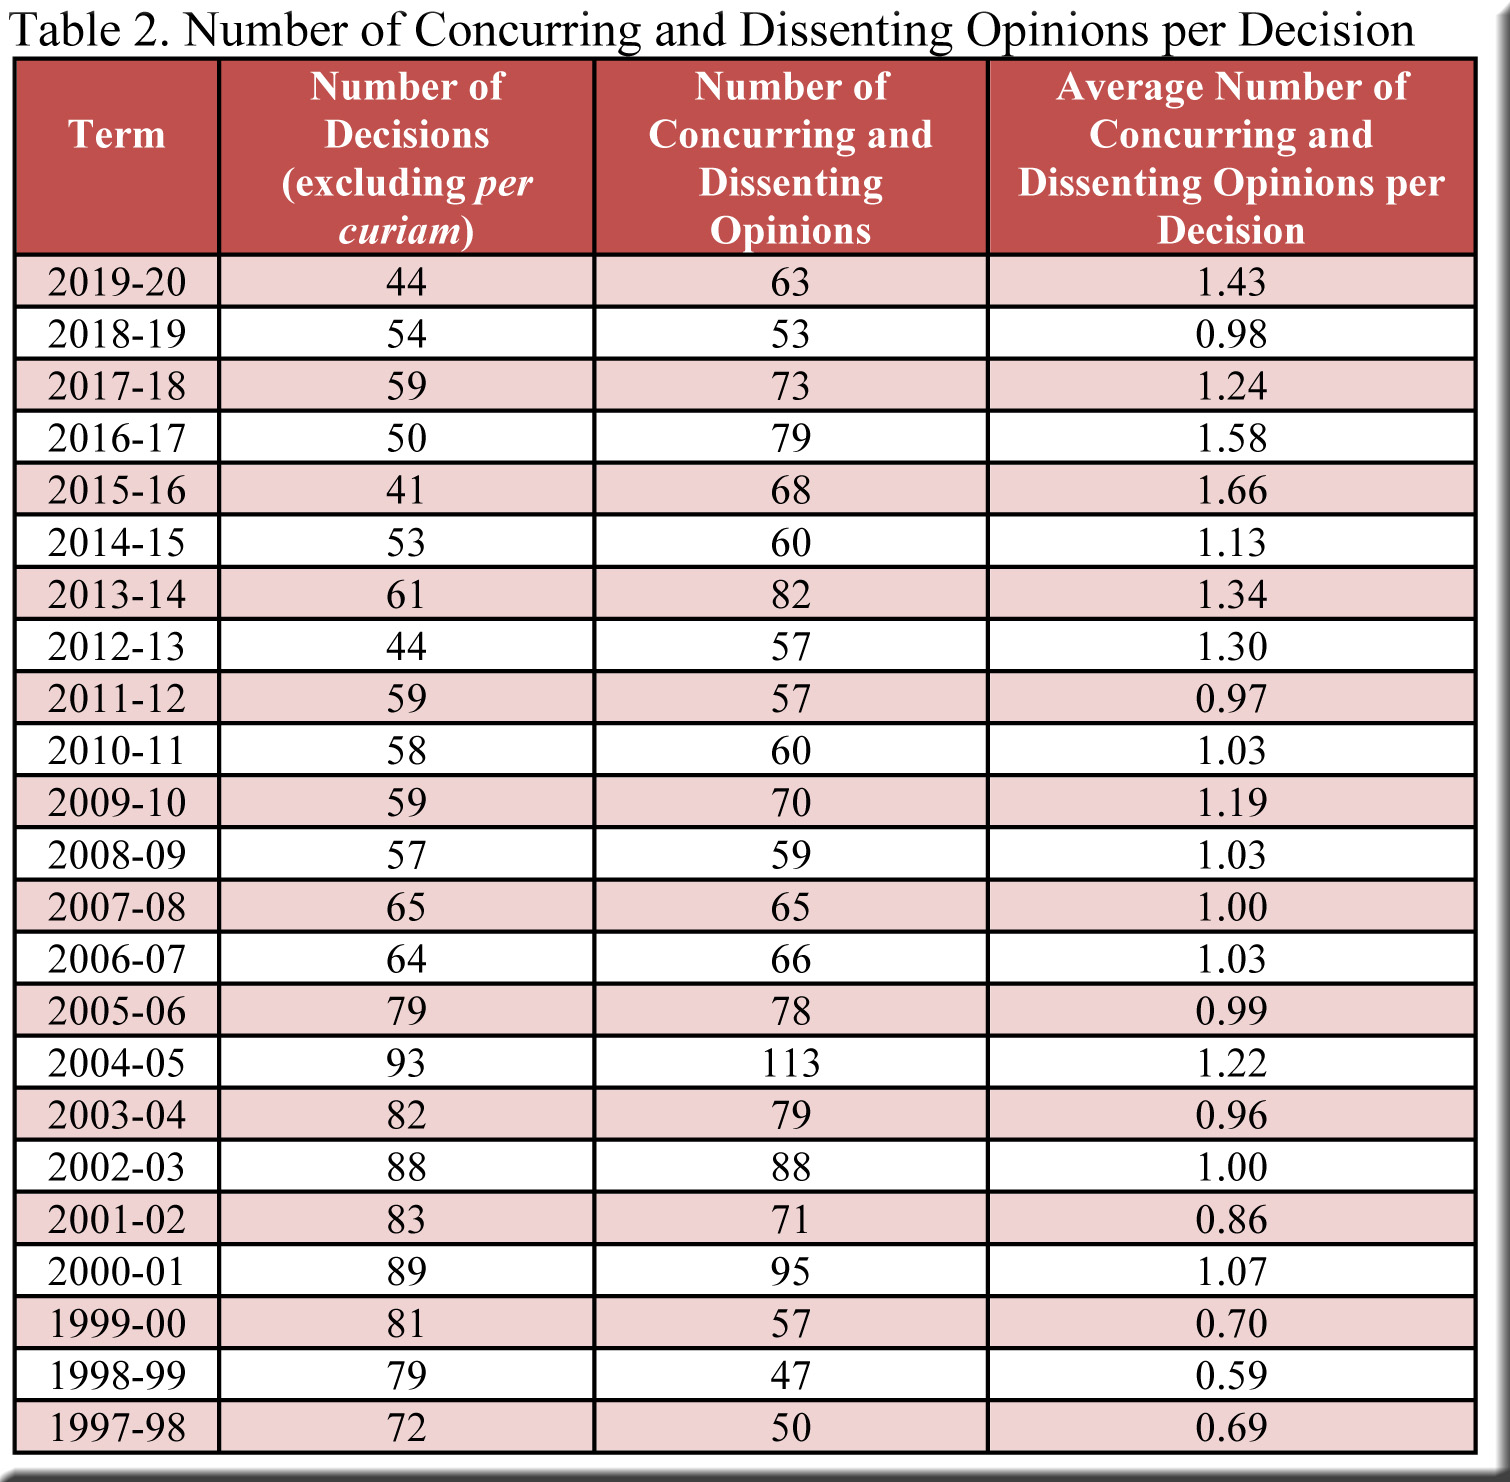
After reaching an historic peak in the middle of the decade, the average number of concurring and dissenting opinions per decision fell sharply during the last two terms, and by 2018-19 the figure had dropped back to its norm for the first 15 years covered by Table 2. However, the table also reveals an abrupt reversal in 2019-20, which witnessed nearly one and a half separate opinions for every decision—the third highest rate of the entire period.[4]
Length of Decisions
This development—the surge in the rate of separate opinions—had a direct impact on our next topic, the length of decisions. After declining for three straight terms, the average number of pages per decision shot up again in 2019-20, as Graph 1 makes clear.[5]

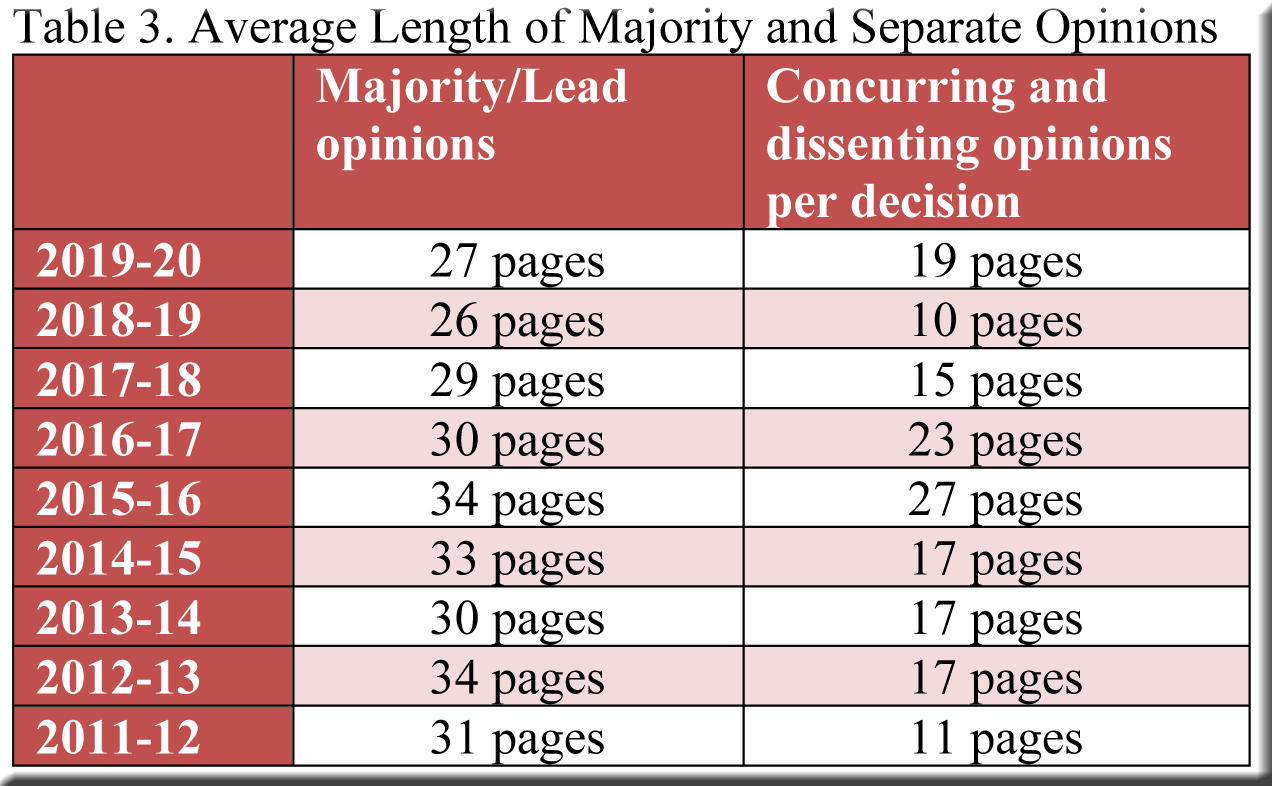
Table 3 demonstrates that almost all of this increase came from separate opinions—which nearly doubled their number of pages per decision compared to 2018-19[6]—while the length of majority/lead opinions remained modest by recent standards.[7]
Time Between Oral Argument and Decision Filing
There might be reason to anticipate that the extraordinarily low number of decisions this term would allow the justices to file their rulings more quickly after oral argument. On the other hand, our findings today—longer decisions together with higher rates of fractured decisions and separate opinions—provide grounds for expecting that a larger number of days elapsed before decisions were filed.
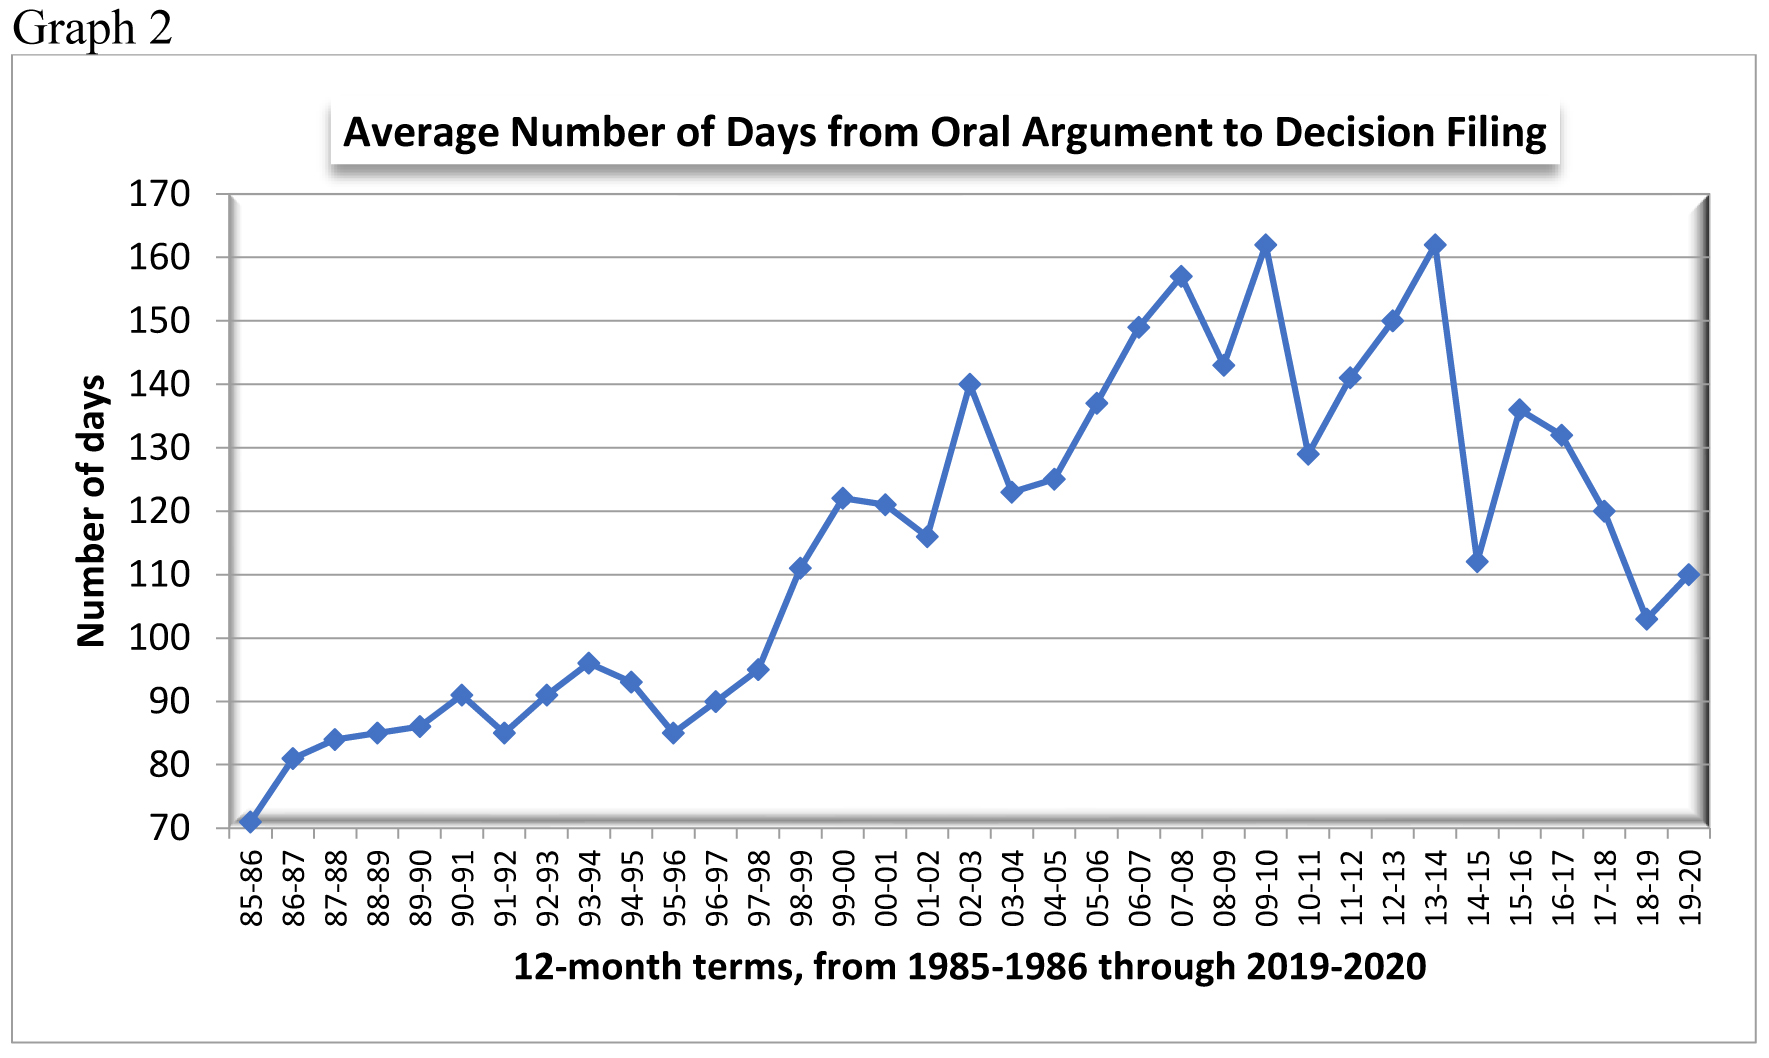
Perhaps these factors neutralized each other to some extent, with the topics in this post proving slightly more influential.[8] In any case, Graph 2 shows that the average number of days did nudge upward, from 103 to 110, though still well below the average for the first two decades of this century.
Conclusion
As noted above, the four indicators covered in this post seem linked in the sense that an increase (or decrease) in one appears to correlate with an increase (or decrease) in the others. This is certainly not counterintuitive, and the correlation has indeed been evident of late in these end-of-term summaries. Maybe next year, two of these indicators will furnish us an interpretive challenge by moving dramatically in opposite directions.
[1] See for example, Ryan C. Williams, “Questioning Marks: Plurality Decisions and Precedential Constraint,” Stanford Law Review, March 2017, and Adam H. Morse, “Rules, Standards, and Fractured Courts,” Oklahoma City University Law Review, Fall 2010.
[2] Three justices filed separate opinions—each concurring in part and dissenting in part.
[3] Emphasis in the original. Morse, “Rules,” 571. The case is United States v. Booker, 543 U.S. 220 (2005).
[4] As the previous post laid out in detail, three-fourths of these concurrences and dissents were penned by four justices (R.G. Bradley, Kelly, Dallet, and Hagedorn).
[5] The averages include title pages—but not the blank page that occurs at the end of each decision.
[6] To be clear, the figures for separate opinions are not the average length of a single concurrence or dissent. They are the average number of pages per decision of concurrences and dissents combined.
[7] Click here for a table showing the average length of majority/lead opinions written by each justice.
[8] Per curiam decisions (only one this term) are excluded.
Speak Your Mind